We use cookies on this site to enhance your user experience
By clicking the Accept button, you agree to us doing so. More info on our cookie policy
We use cookies on this site to enhance your user experience
By clicking the Accept button, you agree to us doing so. More info on our cookie policy
Published: Mar 15, 2020 by marc
This post is an updated version of this article and will be updated on a daily basis.
Code available on GitHub.
Update: 25 March 2020
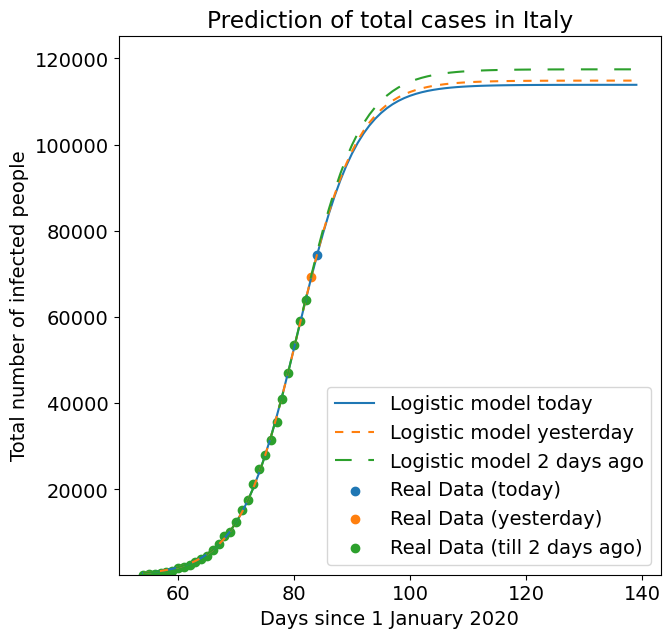
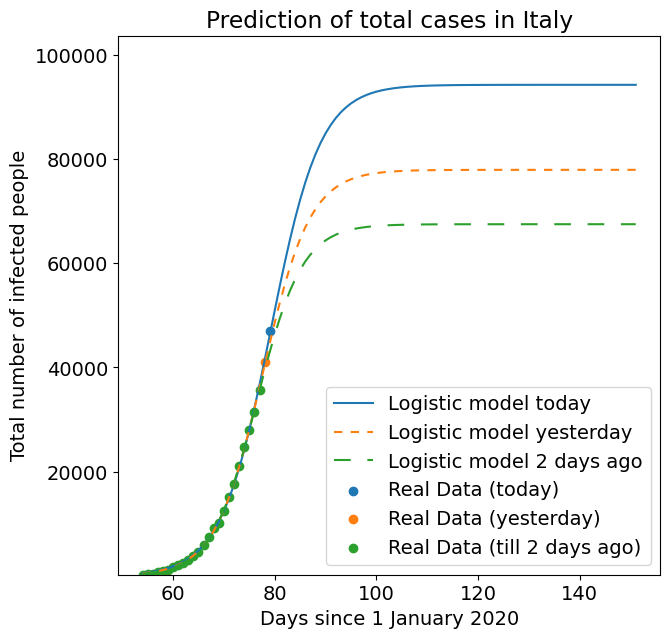
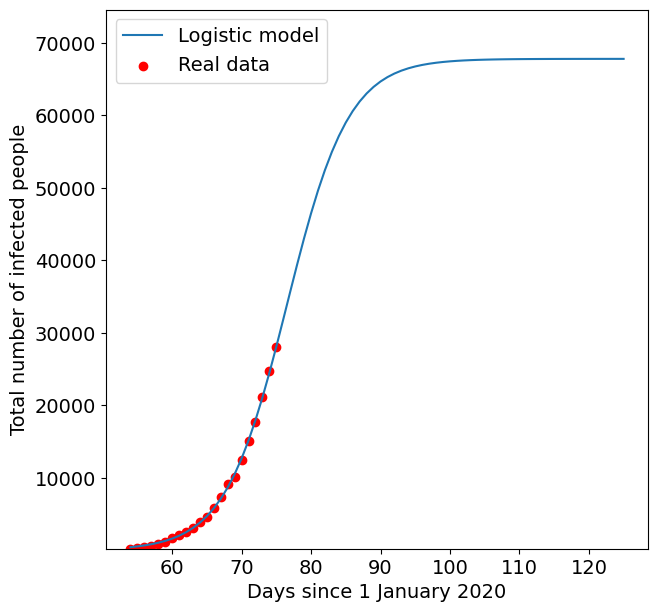
According to the logistic regression model, the predictions are the following:
The image below shows the real data compared to the logistic model.
Update: 23 March 2020
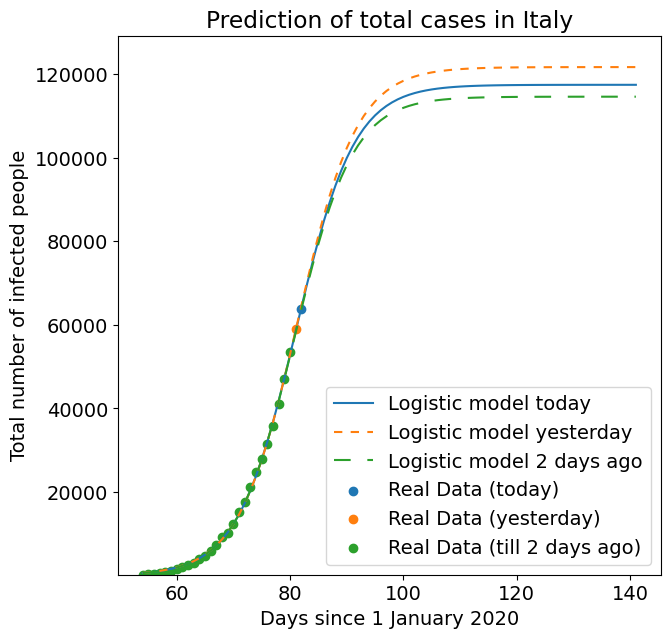
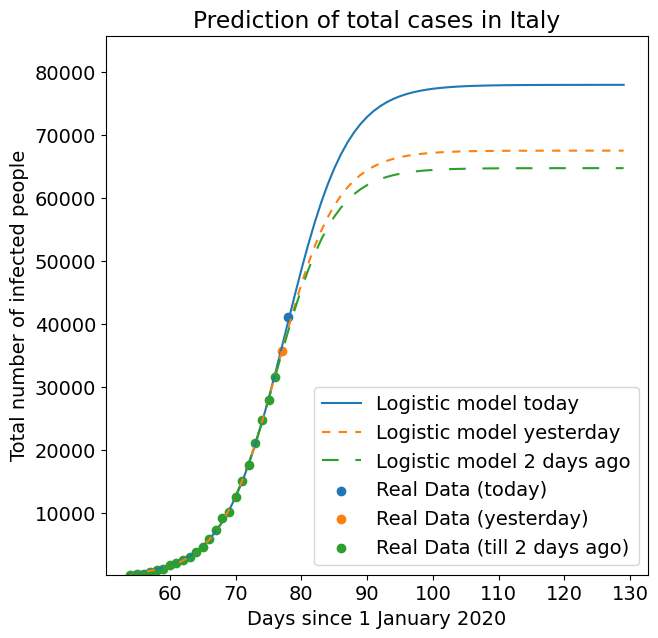
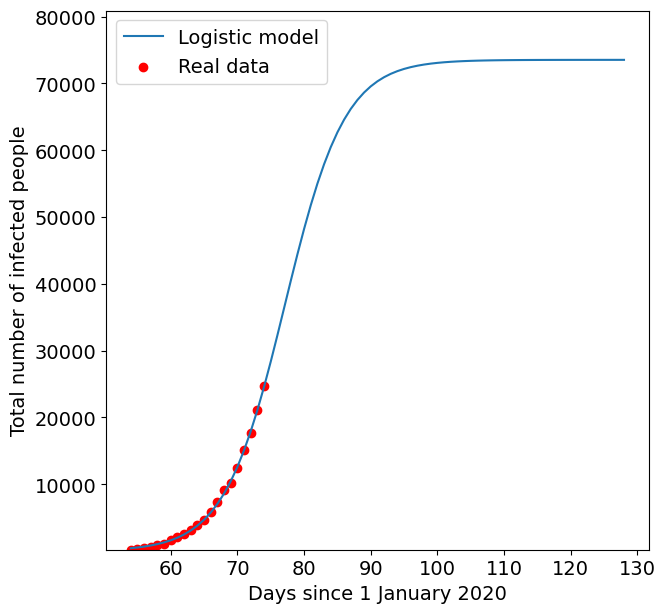
According to the logistic regression model, the predictions are the following:
The image below shows the real data compared to the logistic model.
Update: 22 March 2020
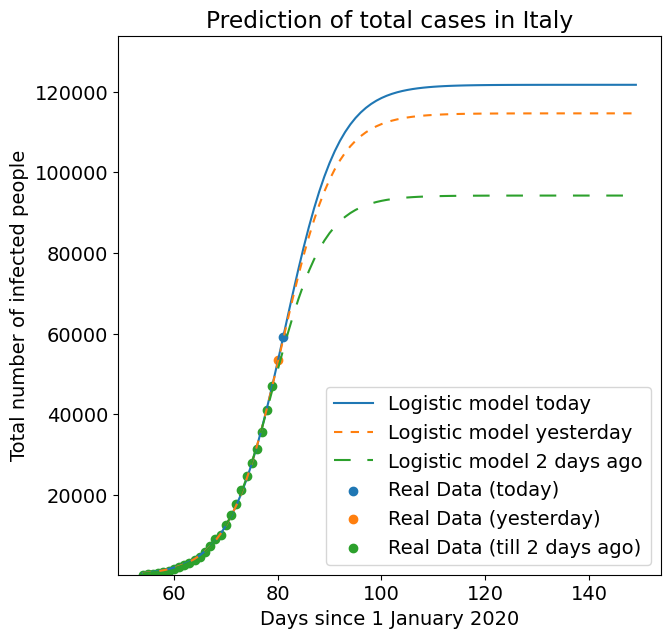
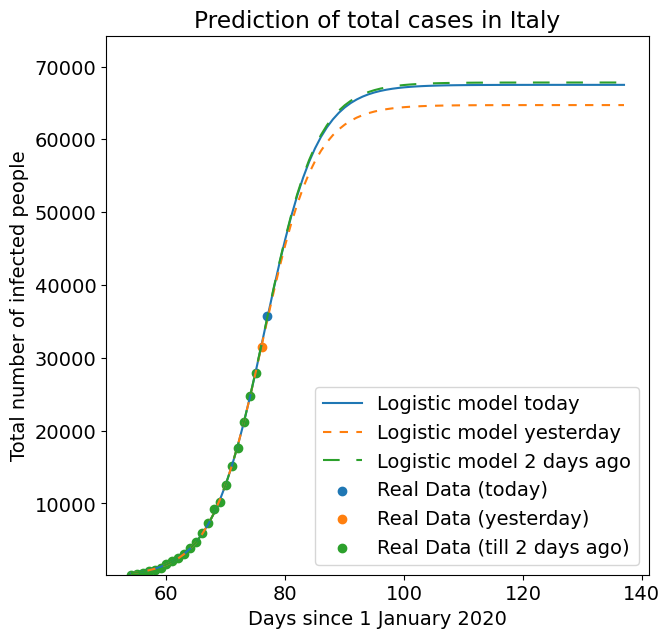
According to the logistic regression model, the predictions are the following:
The image below shows the real data compared to the logistic model.
Update: 21 March 2020
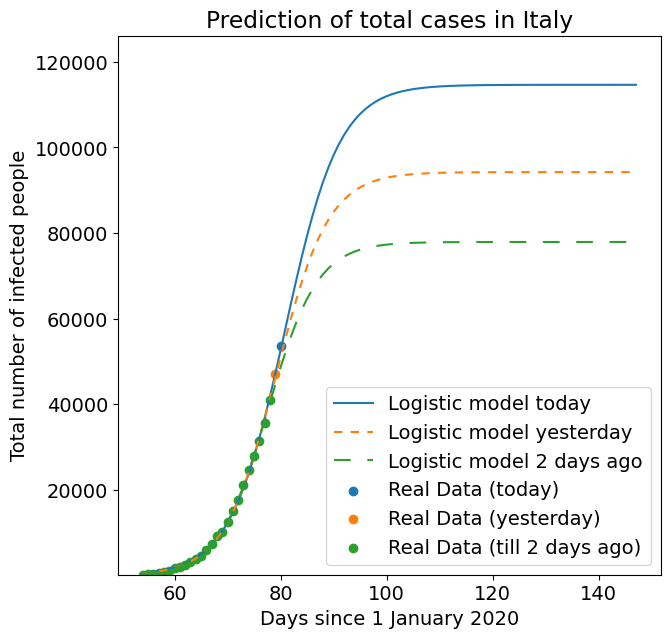
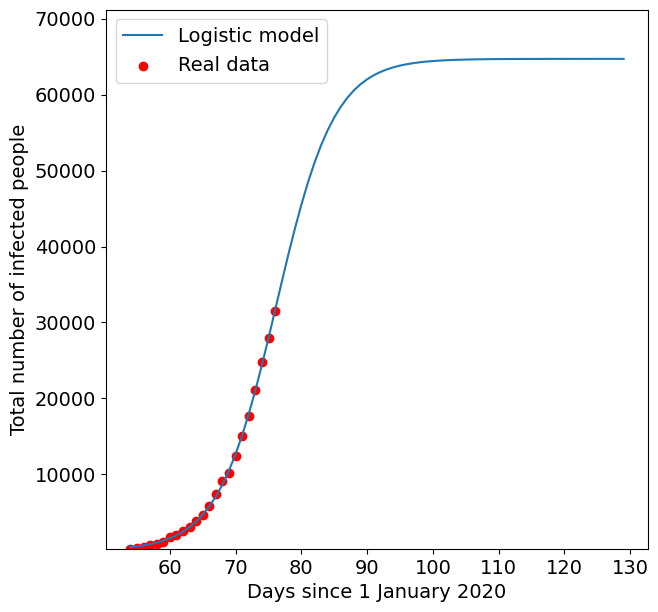
According to the logistic regression model, the predictions are the following:
The image below shows the real data compared to the logistic model.
Update: 20 March 2020
According to the logistic regression model, the predictions are the following:
The image below shows the real data compared to the logistic model.
Update: 19 March 2020
According to the logistic regression model, the predictions are the following:
The image below shows the real data compared to the logistic model.
Update: 18 March 2020
According to the logistic regression model, the predictions are the following:
The image below shows the real data compared to the logistic model.
Update: 17 March 2020
According to the logistic regression model, the predictions are the following:
The image below shows the real data compared to the logistic model.
Update: 16 March 2020
According to the logistic regression model, the predictions are the following:
Observations: new cases and the total number are starting to slow down, this suggests that the infection is near the peak. However two regions were late in reporting the number of new cases.
The image below shows the real data compared to the logistic model.
Update: 15 March 2020
According to the logistic regression model, the predictions are the following:
The image below shows the real data compared to the logistic model.
Update: 14 March 2020
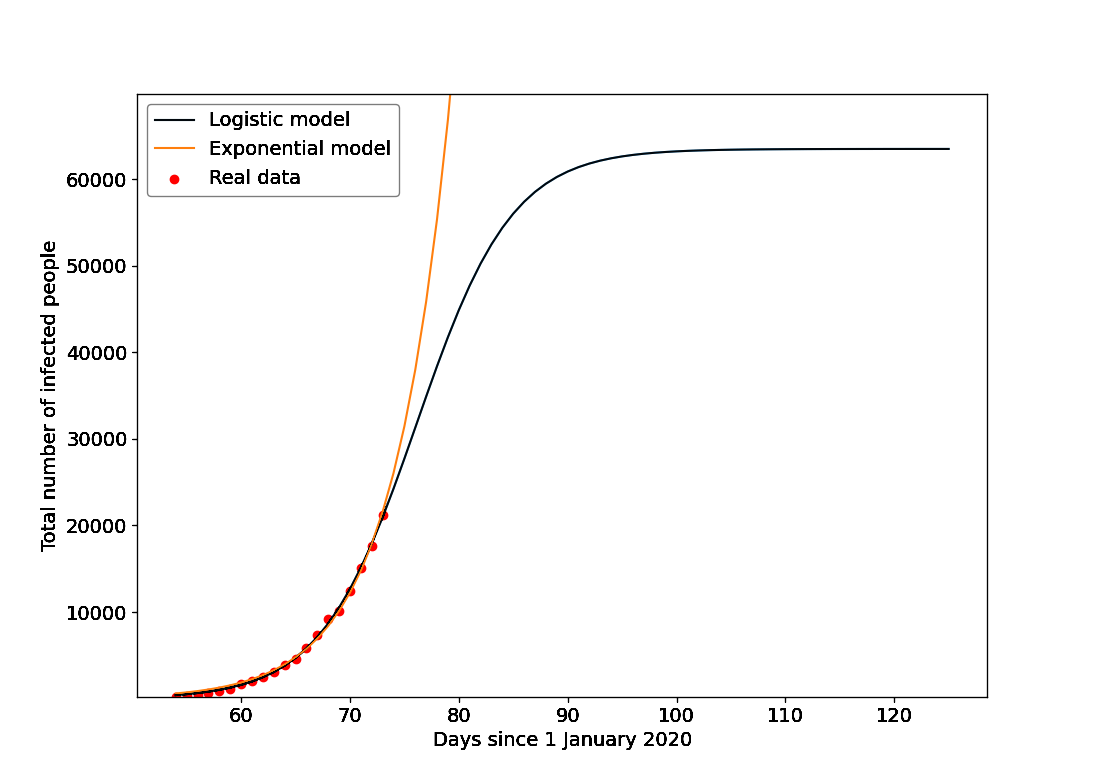
According to the logistic model, the predictions are the following:
This image shows the real data compared to the logistic and exponential model.
Share